Monitor and Troubleshoot Virtual Apps and Desktops on Different Clouds with the Goliath Performance Monitor


When you are running a production environment, such as Citrix Virtual Apps (XenApp) and Desktops (XenDesktop) and VMware Horizon – it is essential to know that your applications, and the Desktop environment is up and running at all times. As you are moving towards a digital workspace and leveraging different types of a cloud solution – a reliable and stable monitoring solution becomes critical. It becomes imperative that you can monitor your application responsiveness, collect statistics about usage, and create threshold-based alerts to notify you when thresholds are exceeded.
Furthermore, moving to a subscription and service-based model, phasing out on-premises infrastructure, or creating a hybrid cloud environment because some of the resources need to remain on site – can be difficult to manage during the transition. But when you’re finished building, it requires good, solid data to stay in control – no matter who’s updating or doing things behind the scenes…
Whether you are using a Virtual Desktop on-premises and using the management plane, like Citrix Cloud or Horizon Cloud, or have it all running in Infrastructure-As-a-Service on Microsoft Azure – you don’t want to use all the separate consoles together to monitor the different solutions you are using. This is where the Goliath Performance Monitor can make a huge difference…
“We cannot control the wind, but we can direct the sail.” – Thomas Sheridan
An interesting quote which always reminds me of how far you can go with monitoring your Workspace and Cloud infrastructure environment…
Define the problem – Most Virtual Desktop customers are using their default monitoring solution, just for the simple reason it is free and included in the product. This solution gathers data insights that will be enough for most customers. But what is enough? That’s an excellent question. How cool would it be to have a monitoring solution that gathers so much information – that you usually only have to reference one set of metrics and already have an educated guess on the right direction to begin troubleshooting? I like this kind of approach because it saves me time to do some other cool stuff in my environment, around innovation, for example!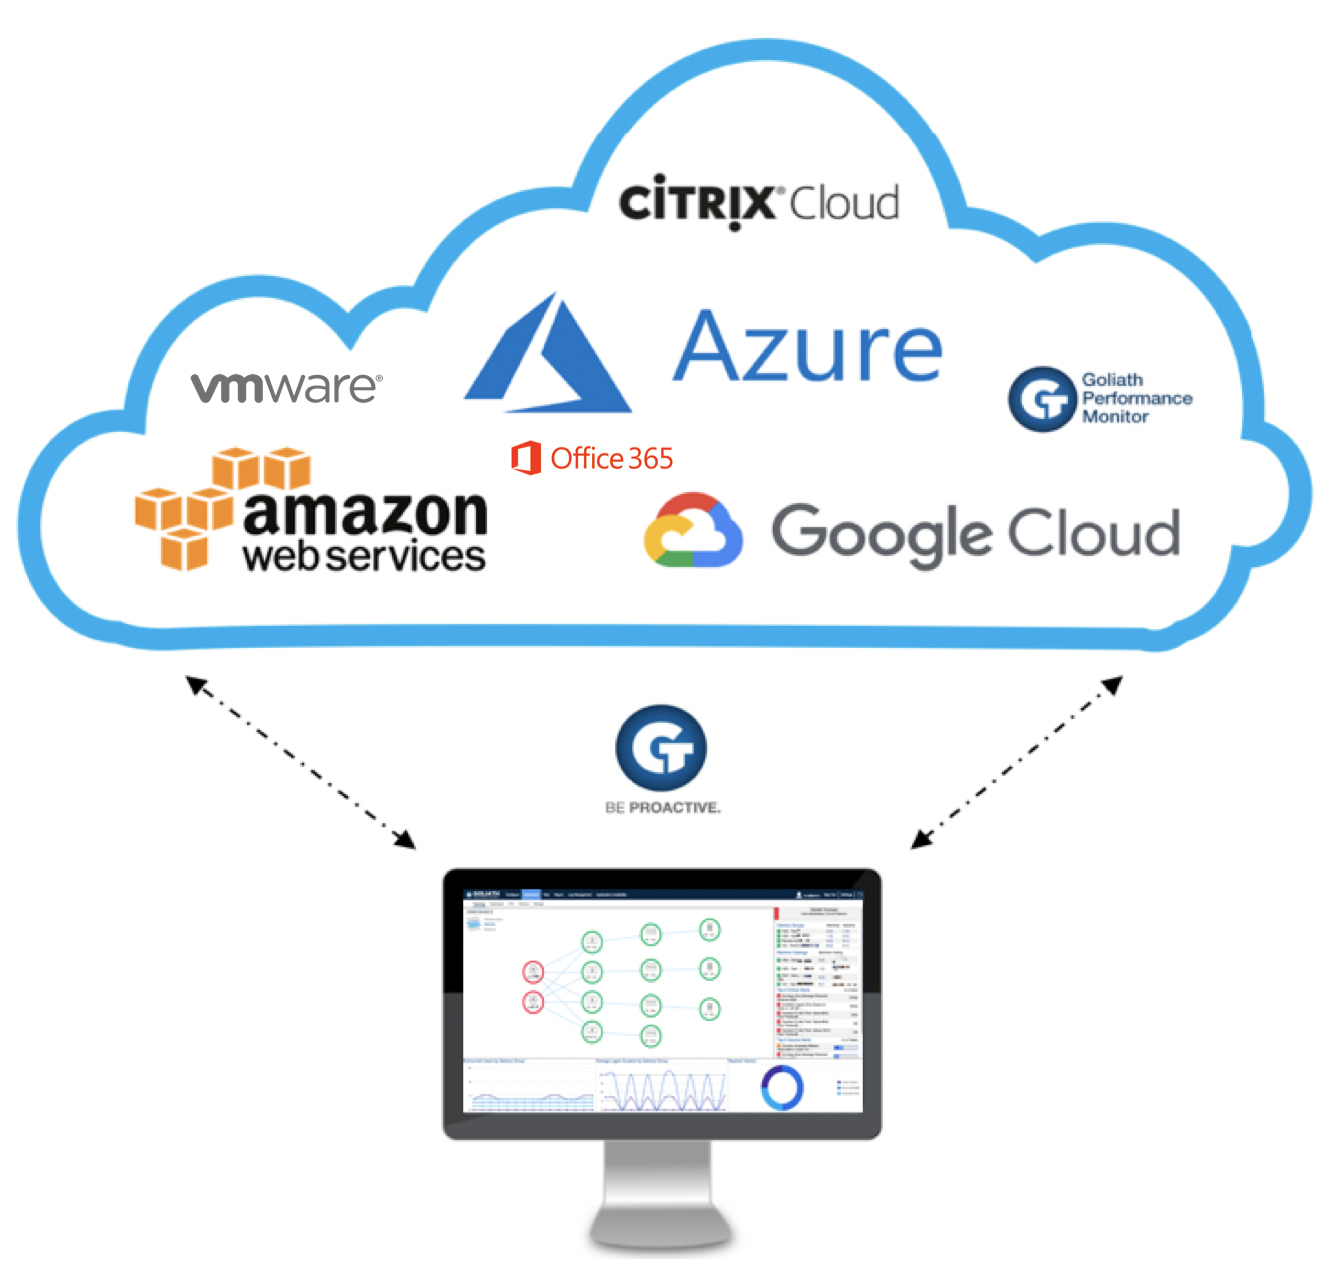
In this article, I’ll explain how easy it is to deploy the Goliath Performance Monitoring software in Azure, Google Cloud, and AWS by using Citrix Cloud – VMware Horizon Cloud Workspaces, including the major benefits of the products when it comes to Cloud workloads.
Enjoy reading!
Table of Contents
Click on the title to jump forward in the article:
- Monitor All of Your Cloud Environments in Real-time through One Single Pane of Glass
- End-User-Computing and Digital Workspace Monitoring
- Real-time Alerting on Resource Consumption for Microsoft Azure
- Analyzing the End-User Session in Detail
- Download a free demo of the product
- Run a Test Yourself – Impression Video
Monitor All of Your Cloud Environments in Real-time Through One Single Pane of Glass
You can deploy Performance Monitor on-premises or in the cloud to identify individual, site or geographic application availability issues. Placing the Goliath Agent in every Cloud Infrastructure-as-a-service (IaaS) environment you want to monitor creates excellent end-to-end visibility for your Monitoring dashboard. All of your resources will be visible in one single console, whether they exist in Azure, Amazon, Google Cloud and later, Citrix Cloud as well. Goliath is working on APIs which supported the monitoring of the Citrix Cloud Control Plane.

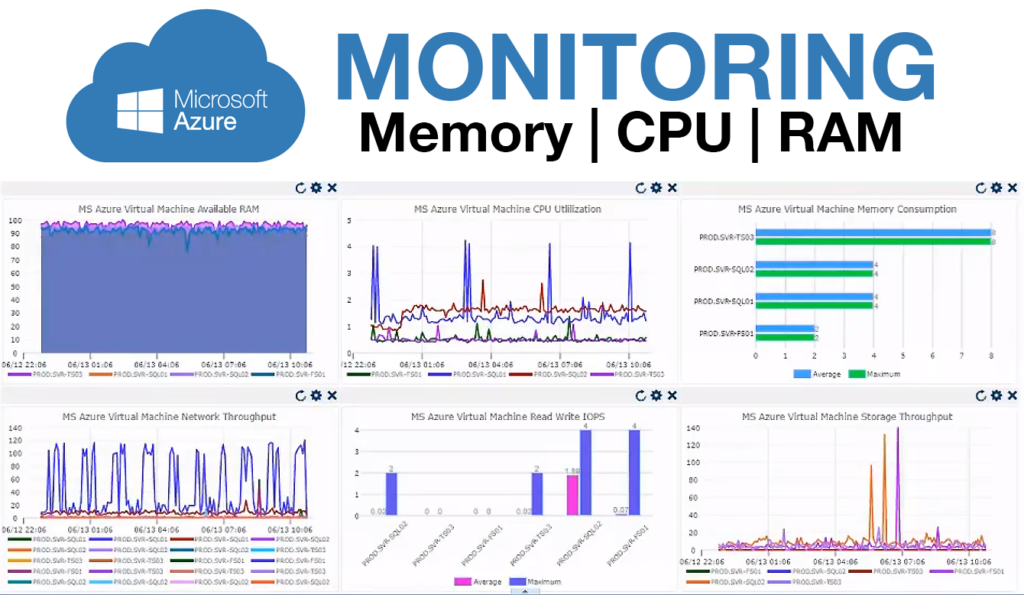
Microsoft Azure Monitoring by Goliath monitors resource utilization at CPU, RAM, Memory levels and more to control costs and give you the real-time accounting of consumption.
Another requirement for the Azure DaaS provider was to have dashboard capabilities that allowed them to see the performance of workloads at a glance. Goliath Azure cloud desktop performance graphs and dashboards permitted them to do that on multiple levels, ranging from their DaaS desktops up through their Azure infrastructure.
This also allowed them to see, if an issue did sneak up on them throughout the gradual process of on-premises to cloud deployment transitioning, where the issue may have originated. They could make active correlations between end-user performance (with singularly located alerts, reports, and dashboards that provide direct end user session metrics) and data being pulled by the Goliath Performance Monitor’s complete visibility of the key performance indicators existing at a utilization level for Microsoft Azure.
End User Computing and Digital Workspace Monitoring
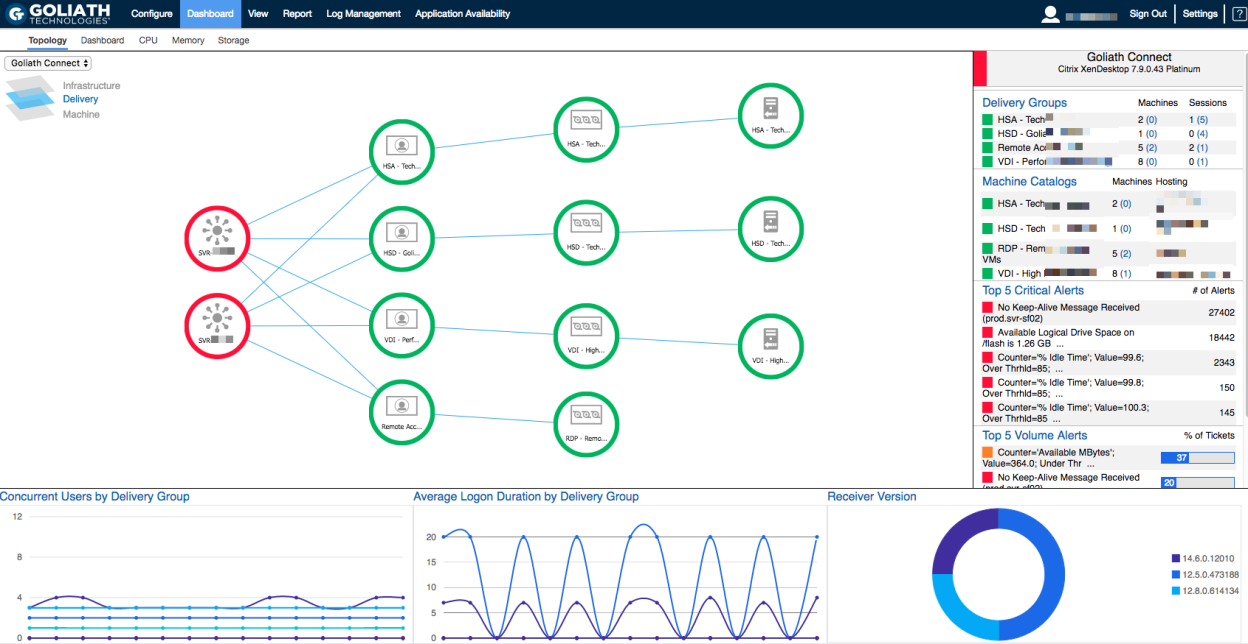
If a user’s Citrix ICA RTT is high, that allows us to quickly identify if there are enough resources for the application and user activity, or if the session host can deliver the responsiveness for the user to have a good experience. If the user is experiencing slowness and it does not manifest in Citrix ICA RTT, the problem is most likely lower in the stack in the host or storage architecture.
The following dashboard is part of the default template for Goliath Monitoring. It automatically detects your Citrix environment and places each resource into the logical procedure in the dashboard, such as the one below.
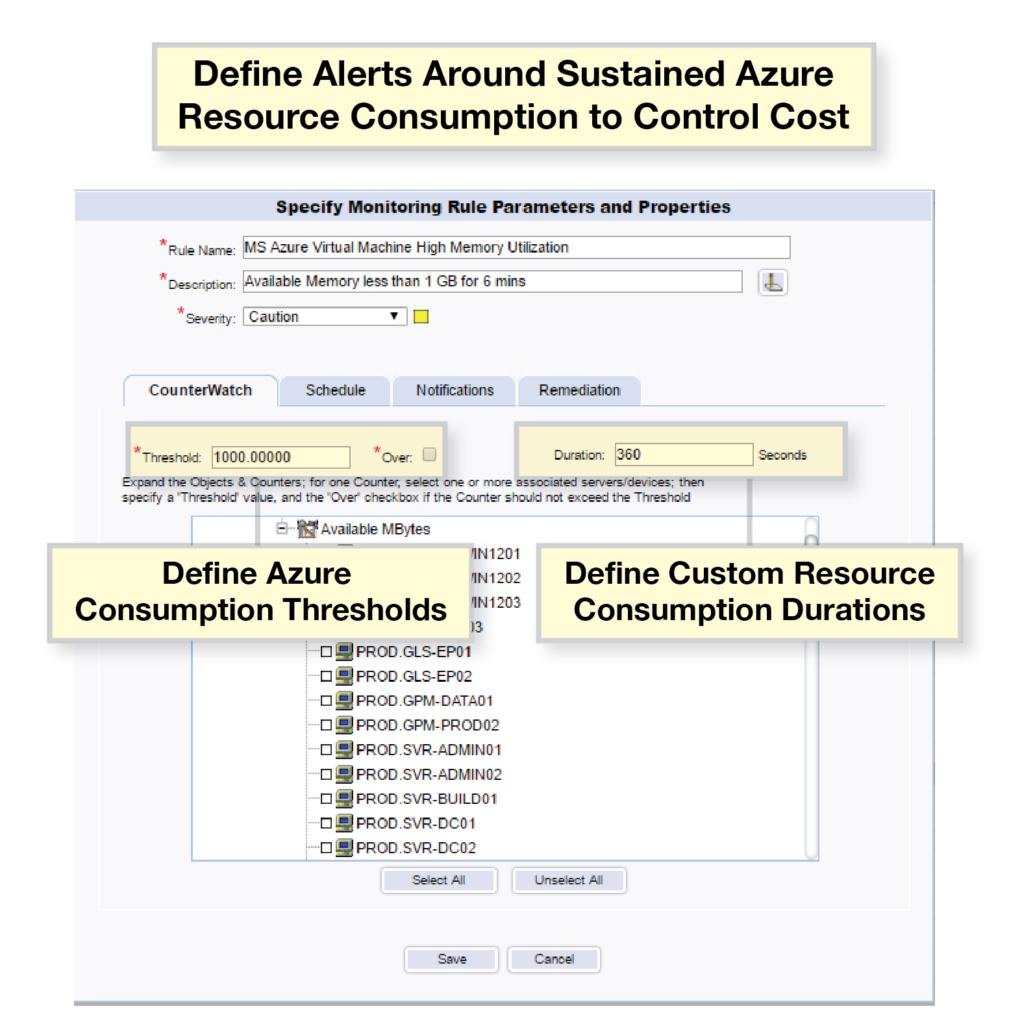
Real-Time Alerting on Resource Consumption for Microsoft Azure
When hosting workloads in the cloud, the priorities are different. An example of this is resource utilization. When resources are on premises, we want to make sure that they are not constrained – which would result in poor end user experience. There are also physical limitations on resource availability and the business needs to know in advance when a capital investment needs to be made.
However, in the cloud, managing resource utilization is more about consumption and managing costs. This is because resources are almost unlimited, but are paid for based on usage. Goliath for Azure Monitoring allows the DaaS provider to dynamically assign policies to workload based on location and use-case in a single click. This means that they can assign rules based on need, as resources are relocated from the datacenter to the cloud. An example of this is below.
Analyzing the End User Session in Detail
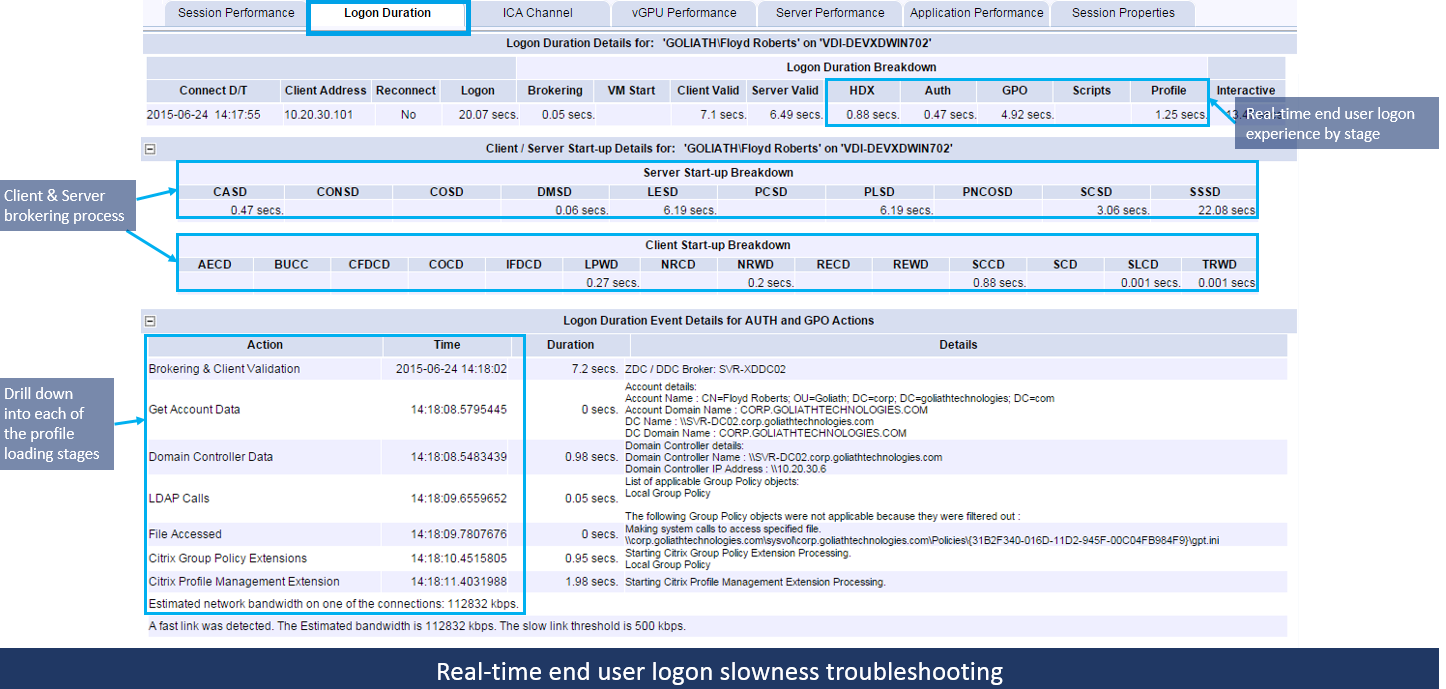
Goliath is able to extend the capabilities and increase the amount of detail in regards to user session monitoring that you would normally see in Citrix Director.
Below is an overview dashboard of what a user’s session logon duration looks like.
- The high-level breakdown of the logon duration for each of the logon stages
- The breakdown of the logon as seen by the broker/controller
- The logon details as seen by the session itself
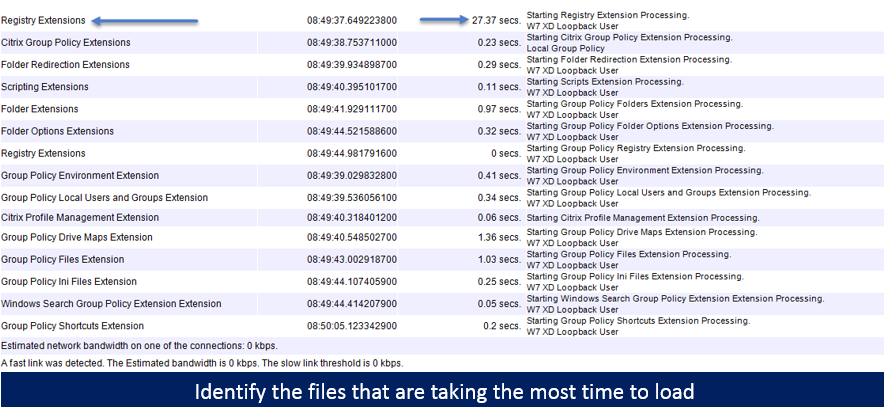
With the ability to drill down into group policy information, you are able to view what their group policies were actually doing. If you use this approach when you begin troubleshooting, you are already well-positioned to start a proper root cause analysis because you begin with good indicators and assumptions.
Download a free demo of the product
Go to the following URL and fill out the form below to download your free demo!
https://goliathtechnologies.com/schedule-demo/
See for yourself – Goliath Monitoring – Impression Video
Click below to see what the Citrix dashboard integration of Goliath Technologies looks like. It is very simple to load and easy to manage.
Are you as excited about this technology as I am? Please let me know what you think in the comment section of this article.
Thanks for reading.
Cheers,
Christiaan Brinkhoff