
Things You Need To Know About Desktop Virtualization and Cloud from the VDILIKEAPRO: State of the Union 2019 survey


A couple of weeks ago we released our yearly—again well received—VDI Like A Pro 2019 survey. As always it includes existing and new questions which are released to the VDI landscape.
“’Without data, you’re just another person with an opinion”
Ruben, Mark and myself came several times together to discuss what we must take out and what (new questions) to put into the survey. This information is very valuable because it shows how the market is shifting (or not).
This year, in total, almost 600 people started the survey and on average completed the survey in less than 10 minutes. Participants from 67 countries around the globe.
In this article, I’ll share the highlights of this year’s State Of The Union 2019 survey with a focus on Cloud.
Download the full 2019 survey here.
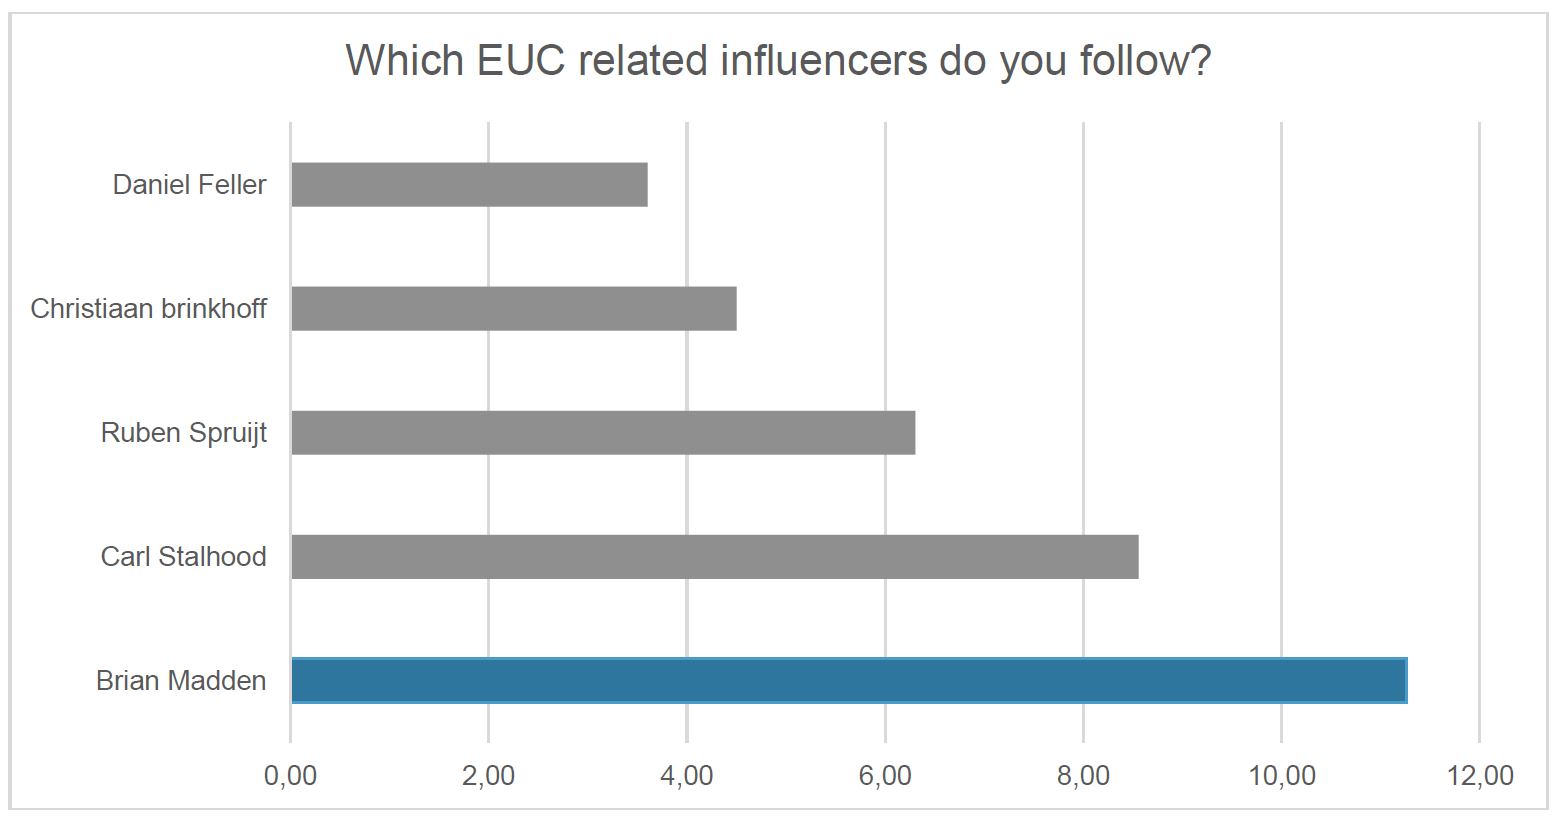
Which EUC related influencers do you follow?
New in the top 5 this year is Christiaan Brinkhoff (me) and Daniel Feller, but with 11.2% of the votes, Brian Madden remains on top position for 2019.
Thanks, everyone who’s consistent in following me!
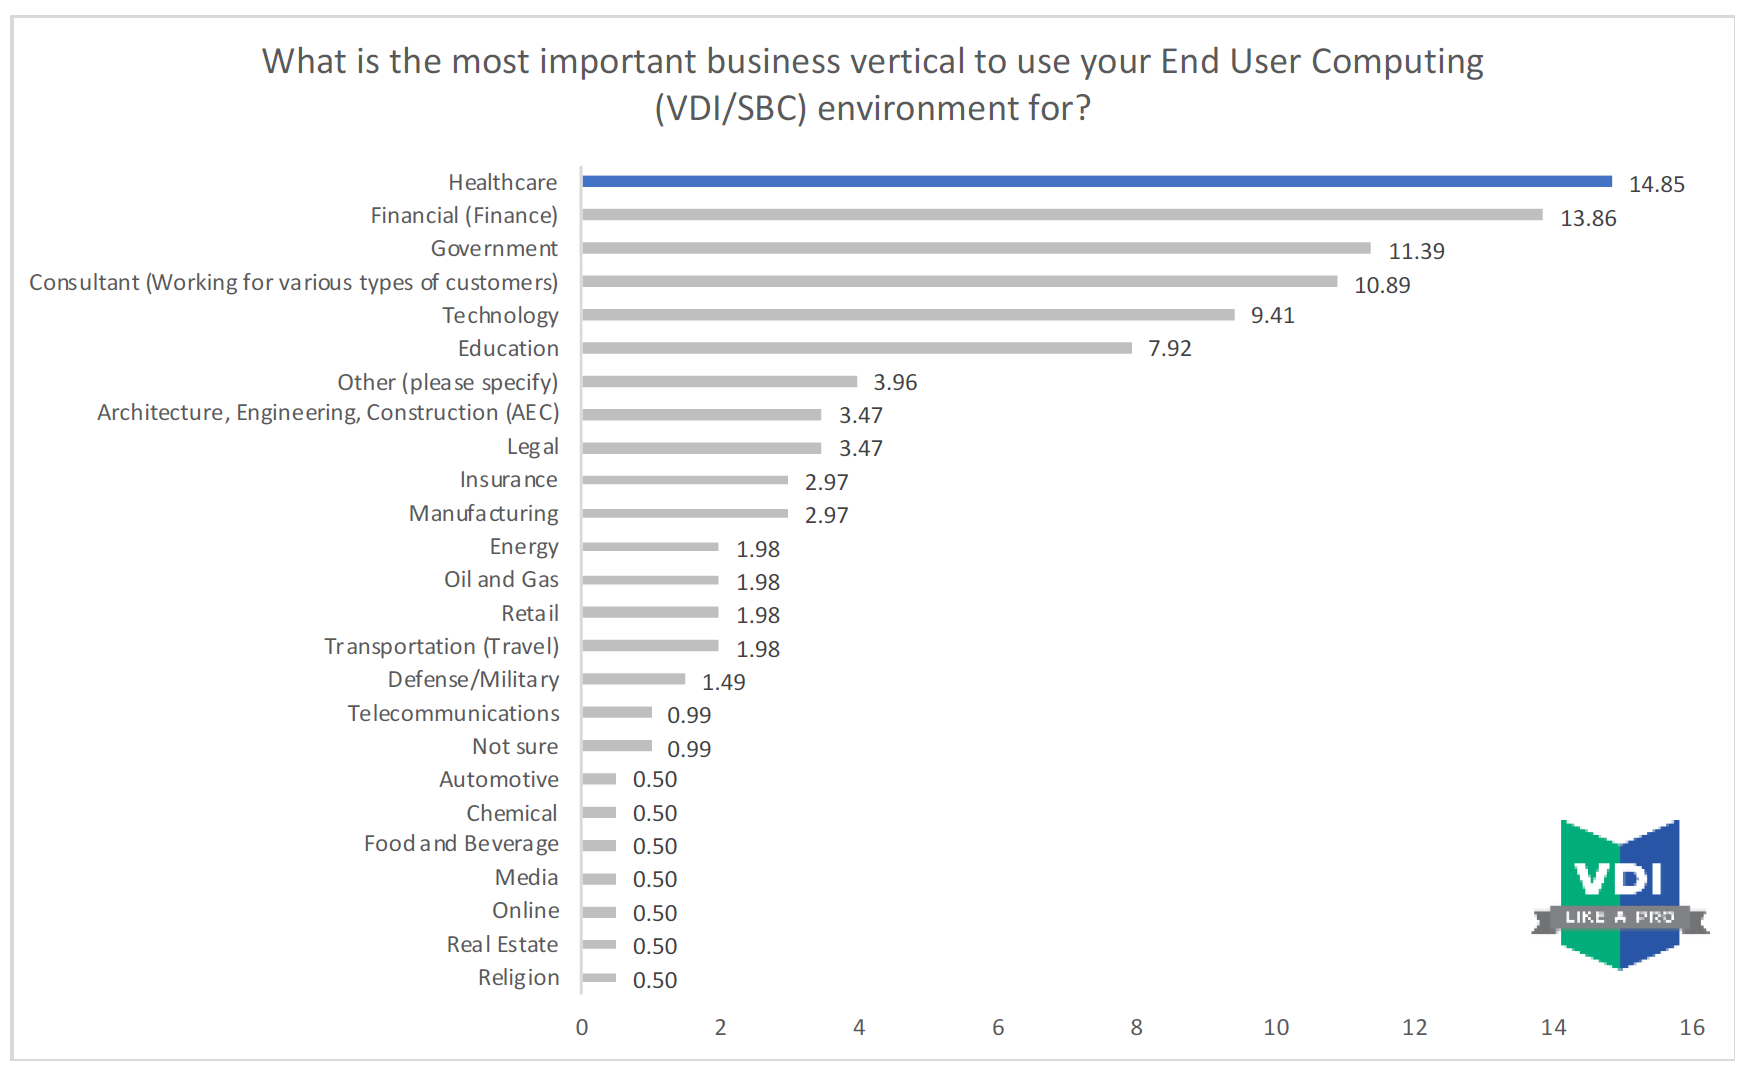
Desktop Virtualization still most popular in healthcare vertical
With 14.85% Healthcare continues to be the largest business vertical market for on-premises VDI and Server Based Computing solutions.
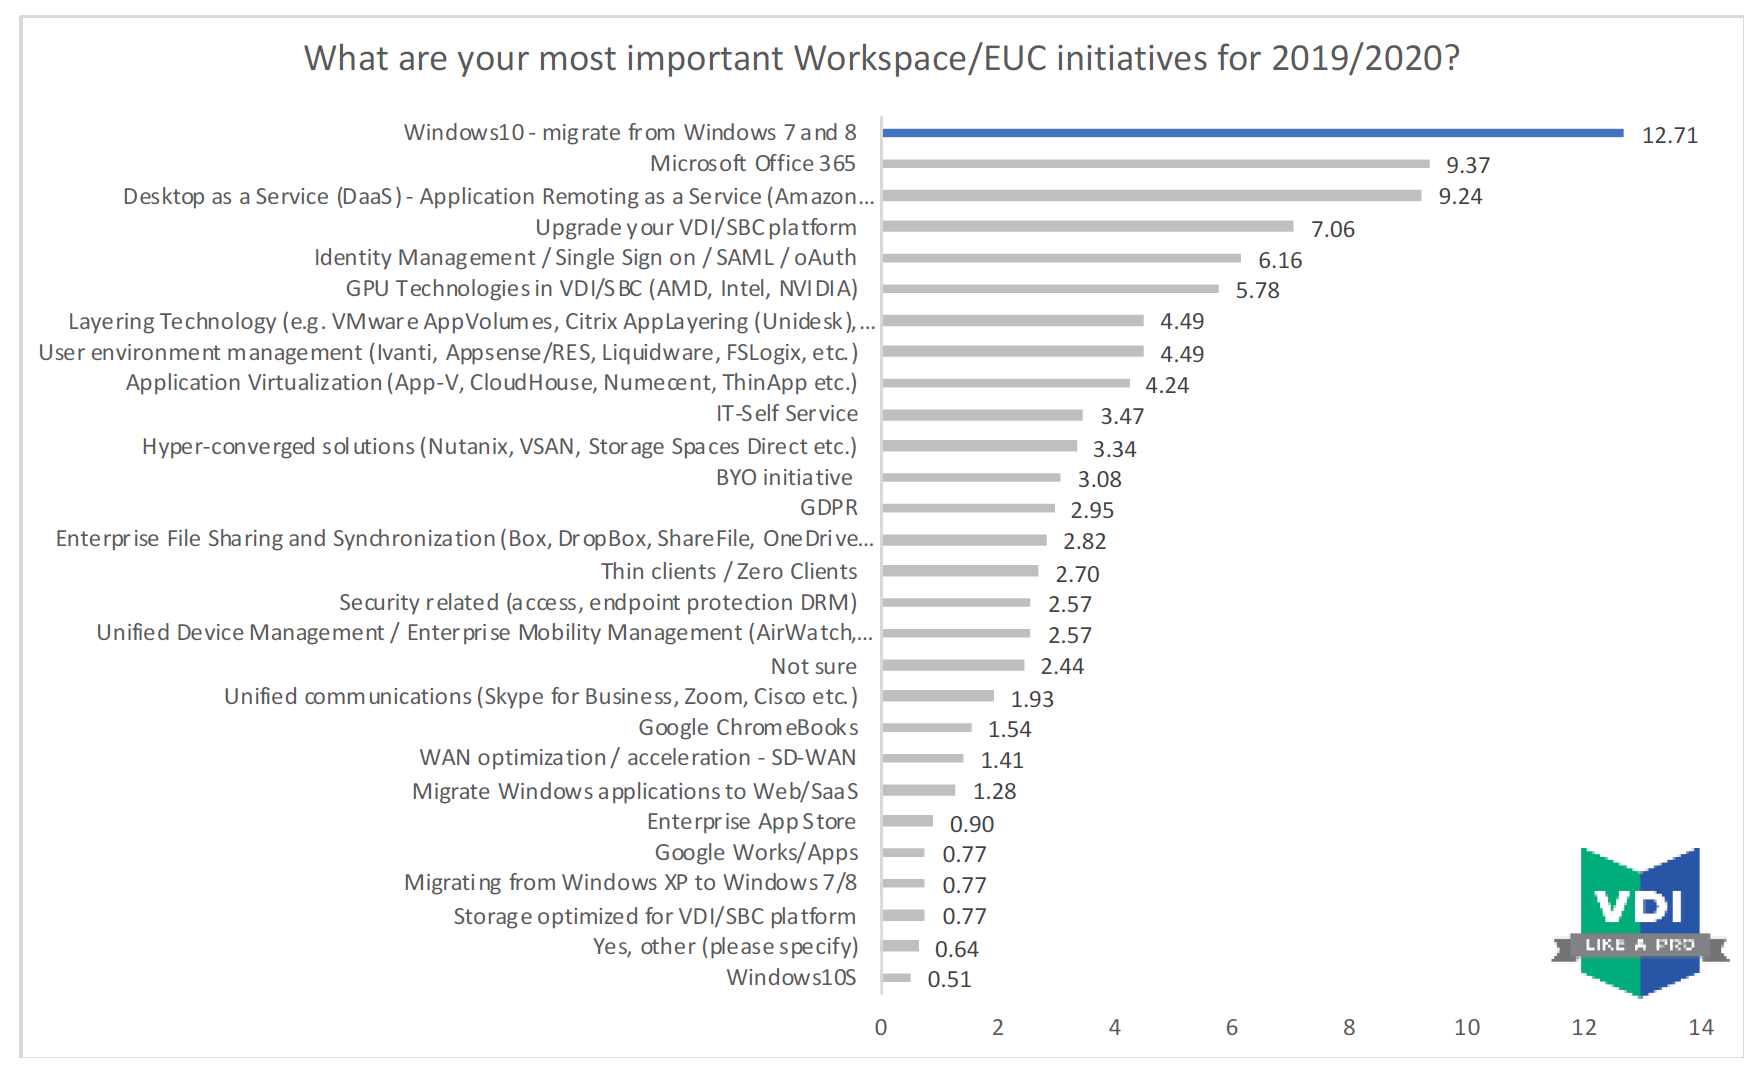
Upcoming Workspace/EUC initiatives in 2019 and 2020
Unsurprisingly, most of the respondents (12.71%) are busy digging into Windows 10 and migrating their current solution to Windows 10. The second-most important initiative for 2019/2020 is Office 365 at 9.37% followed by DaaS with 9.24%.
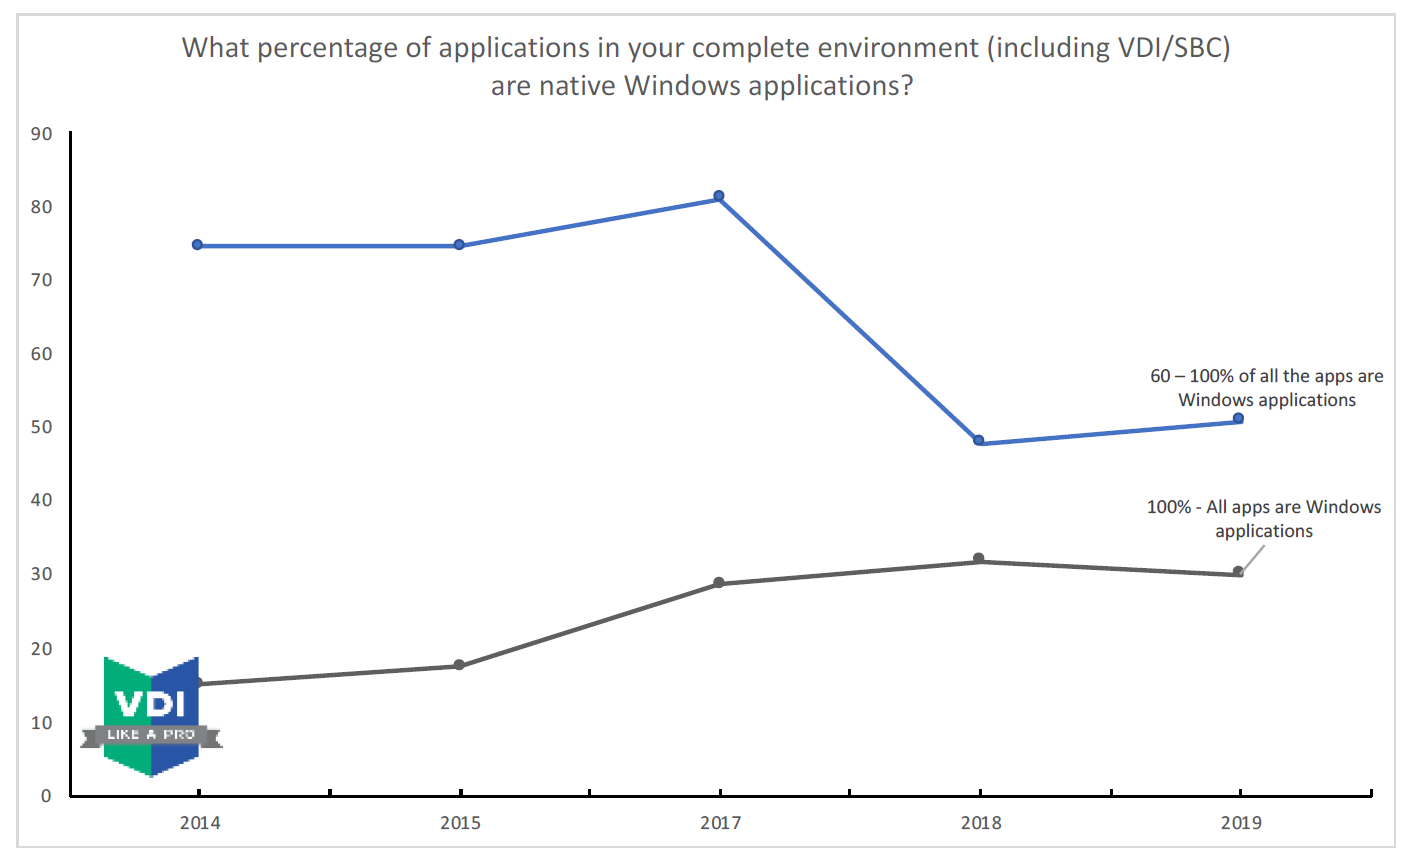
Windows Applications still going strong!
While more participants are using application virtualization, we do see that those who do virtualize their applications have a higher adoption rate as the 80-100% category grew from 19.17% in 2017, 26.32% in 2018 and 30.86% in 2019.
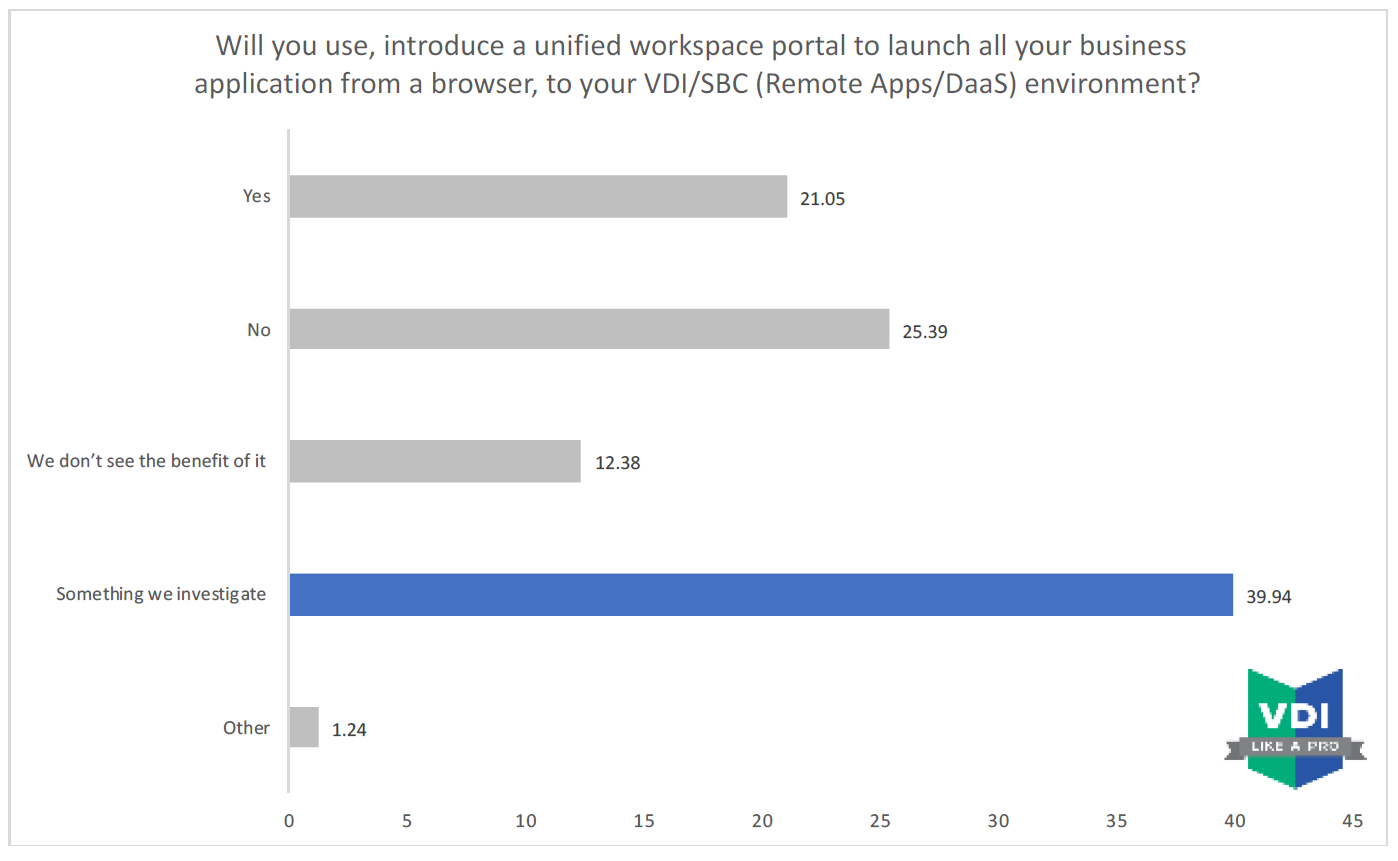
Unified Workspace portal market interest
This year, we added a new section around unified workspace portals to the survey. A Unified Workspace portal will bring Windows, Web/SaaS applications and data together.
A workspace portal often is referenced as “Workspace aggregator”. 39.94% of the participants are investigating if they will add a workspace portal to their environment while 21.05% already are using solutions from Citrix, Liquit, Microsoft, Software2, Parallels, Workspace365, VMware or others.
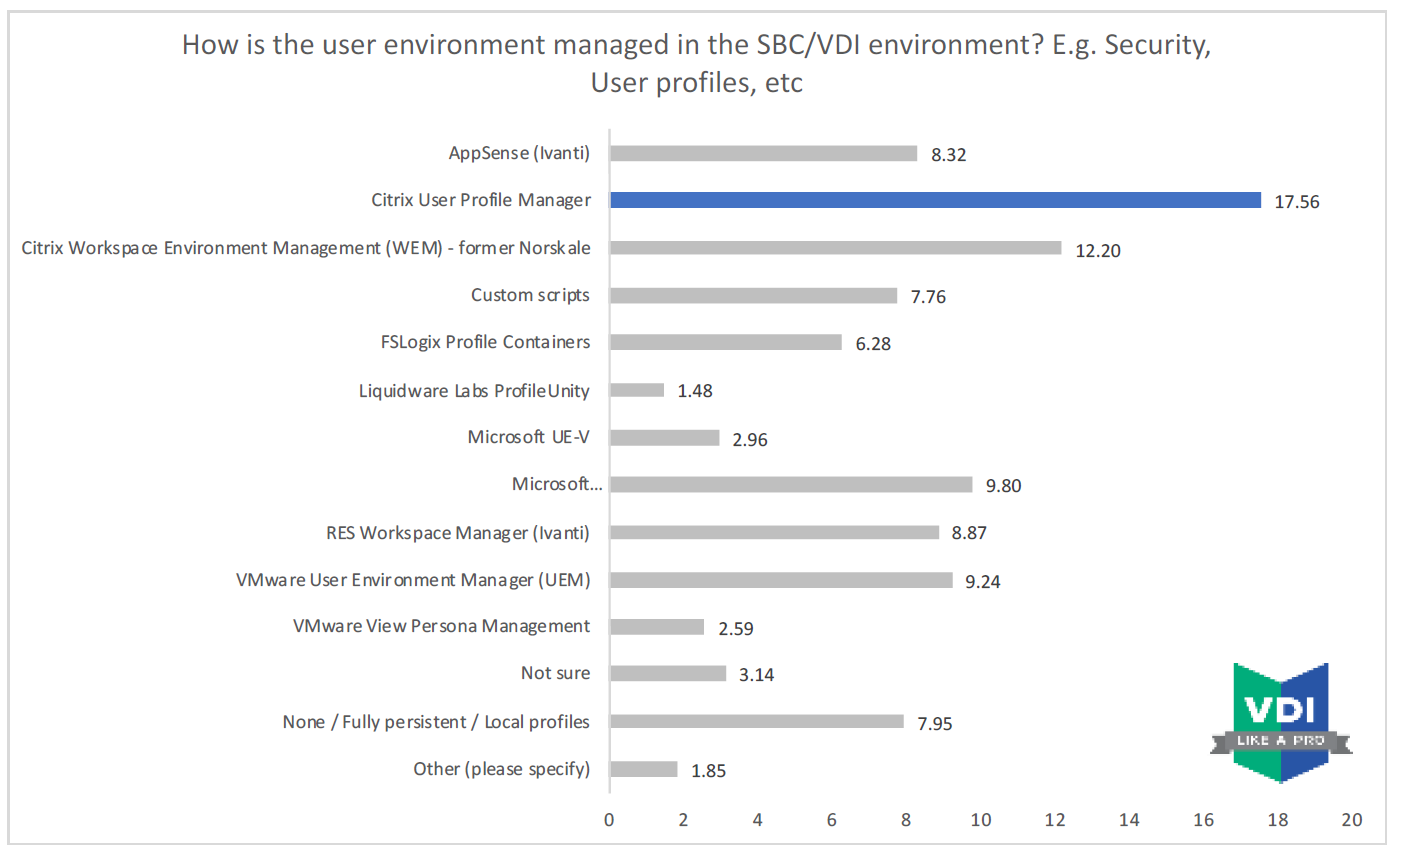
Usage of FSlogix (now part of Microsoft) increased
Most of the organizations use user environment management (UEM) solutions from Citrix, Microsoft or VMware, totaling 54.35% in 2019. UEM solutions such as Ivanti (Appsense and RES), FSlogix, and Liquidware are used within 24.95% of the organizations. Usage of FSlogix (now part of Microsoft) increased with 2.38% over the last year while Liquidware declined from 2.60% in 2018 to 1.48% in 2019.
Expectations are that FSLogix will gain in demand after the recent announcements of making the product free available for on-premises VDI customers. Also because FSLogix is the underlying profile technology behind Azure Virtual Desktop.
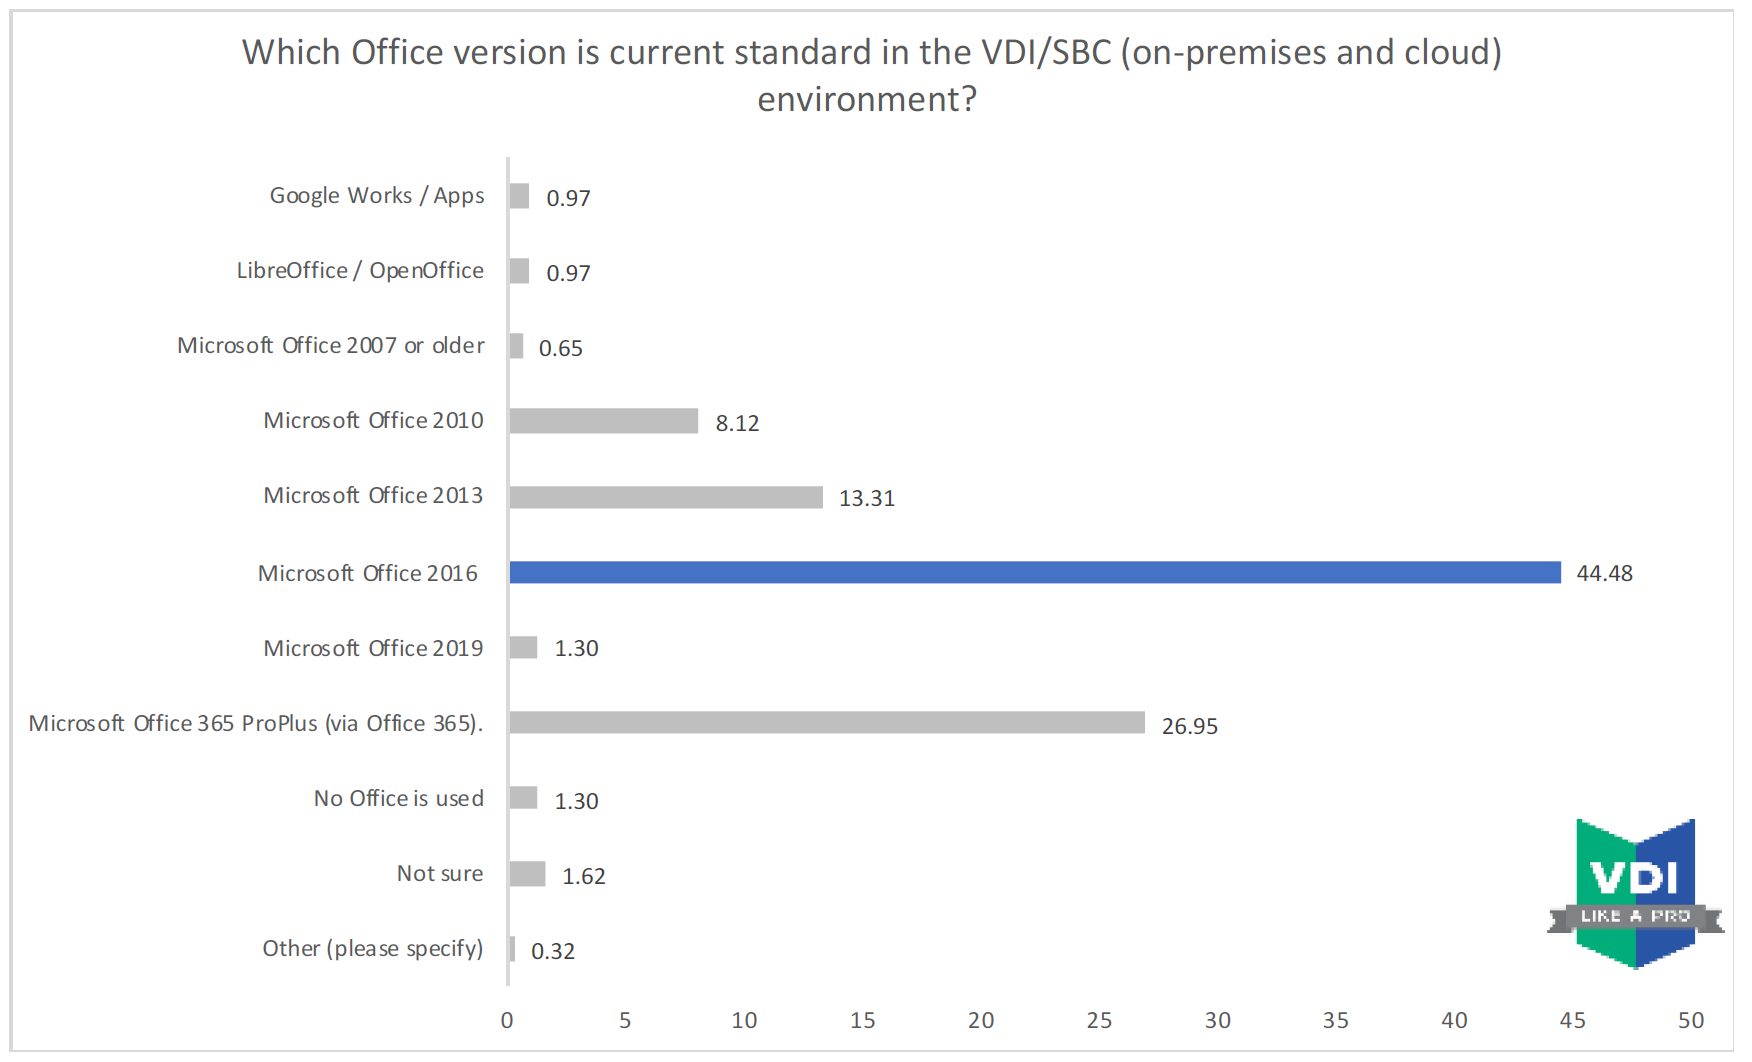
We are shifting more to Office 365 ProPlus (subscription)
Most participants are using Microsoft Office 2016, 44.48% while 26.95% are using the latest office build delivered via Office365. Expectations are that this number will grow after the recent announcements to support Office 365 ProPlus on Server 2019 (announcement blog here). Office 2019 is used in 1.30% of the deployments.
Microsoft Office 2013 usage is declined from 25.30% in 2018 to 13.31% in 2019. Microsoft Office2010 is used in 8.12%% of the environments. Google Works/Apps it is being used in 0.97% of the VDI/SBC environments. Based on customer feedback in the field we do see Google Apps growing, not so much in VDI and SBC, but more on physical devices, such as Chromebooks and other devices.
Other highlights
• Centralized management, DaaS, and security are the primary reasons for SBC adoption, with cost reduction becoming an increasingly important factor as well.
• In 2019 around 8.7% of the participants are switching from SBC to VDI, 10.80% are considering Windows 10 Multi user via Azure Virtual Desktop (AVD).
• “Work isn’t a place, it’s something you do” — this statement applies to many. With increasing focus on digital transformation, user experience, and collaboration, we clearly see more people are using unified communications.
• 27.82% of the participants are either already using or plan on changing to public cloud Desktop as a Service / Remote Application as a Service solutions which is a decrease of 7% compared to 2018.
• Remote application and Desktop as a Service provided by a service provider using Citrix, Microsoft or VMware solutions are being considered by 23.36% of the participants which is an increase of 7.36% compared to 2018. Citrix Cloud will be introduced or is being used by 15.99% which is a decrease of 2.17% compared to 2018.
• The four biggest challenges in adopting public cloud Desktop as a Service (DaaS) and application remoting as a service are cost (23.20%), trust (11.51%), creating a positive business case (11.34%) and performance (11.34%). Legal and regulation with 10.65% also is a challenge.
• There were slightly more SBC environments this year compared to 2018 but, overall, the trend has been stable.
• The usage of Windows Server 2016 in Server Based Computing is at 37.76% which is 12.4% increase compared to 2018.
• Compared to the survey results of past years, we clearly see more VDI environments running 5 years and older. Newly designed VDI environments declining from 3.07% in 2017 to 1.18% in 2018 and increased to 3.57% in 2019.
• VDI environments with 100K concurrent users has been increased from 0.6% in 2018 to 2.2% in 2019.
• Most participants do use Citrix VDI on-premises technology, 50.29% in 2019, a decrease of 7.4% compared to 2018. VMware is being used in 30.11% of the deployments an increase of 3.2%.
• The biggest difference is in the number of participants who are seriously considering moving away from on-premises to public cloud DaaS offerings — 12.57% in 2018, with 10.61% investigating their options and 14.24% in 2019, with 10.85% investigating their options.
• With more than 57%%, usage of Windows 10 surpassed Windows 7 (21.7%) as the main platform for VDI.
• Just over half the respondents (54.41%) patch their systems once per month, which is an 3.4% increase compared to 2018.
• Microsoft OMS/SCOM is the most popular solution to monitor the SBC/VDI environment, 12.09% of the respondents are using the Microsoft solution which is a decrease of 2.29% compared to 2018.
• While more participants are using application virtualization, we do see that those who do virtualize their applications have a higher adoption rate as the 80-100% category grew from 19.17% in 2017, 26.32% in 2018 and 30.86% in 2019.
• The biggest competitor for application virtualization solutions isn’t Microsoft or VMware — it’s NoAppVirt. Almost 32.25% of the organizations are not using any application virtualization solutions (like Microsoft App-V, VMware ThinApp, Cloudhouse, Numecent or Turbo).
• While most respondents aren’t using layering solutions in VDI/SBC, 74.16% in 2017, 66.59% in 2018 and 60.13% in 2019 it is interesting to see more people are using Citrix and VMware.
• 36.27% of the participants use MSI/MST to deploy their office applications to VDI/SBC while 25.82% manually install Office and 25.49% use click-to run. On 7.52% use 3rd party solutions to deploy and configure office applications.
• The biggest GPU competitors aren’t AMD versus Intel versus NVIDIA—it’s the CPU. Many organizations think the CPU can handle the graphics-related activities and therefore don’t use GPUs. “No GPU” declined from 78% in 2014, 67% in 2016, 56% in 2017, 44.92% in 2018 and 43.06% in 2019.
• Many organizations think the CPU can handle the graphics-related activities and therefore don’t use GPUs.
• All dual-display configurations combined totals 58.57% and are more popular than a single display configuration at 35.51%. Dual display configuration surpassed single display configuration in 2019.
Thank you for stopping by.
Cheers,
Christiaan Brinkhoff